Haley BartelThe emotional effects of the COVID-19 pandemic on children: what the first two months without a…On any given weekday afternoon from the hours of 3:00–4:00pm, you can expect to find New York City streets dominated by teenagers. They…9 min read·May 9, 2022----
Haley BartelLove Island UK S6 in DataThe past month or so, I have been addicted to Love Island — season 6 specifically. It has consumed nearly all of my free time, so when it…3 min read·Dec 17, 2020----
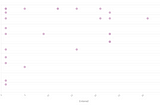
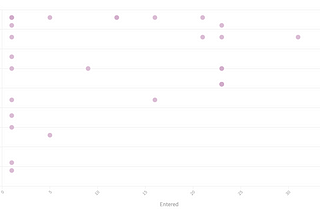
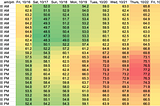
Haley BartelFirst Few Final GraphsFor my final, I am going to be analyzing season 6 of Love Island. I have a lot more planned, but here is some of my initial work.1 min read·Nov 24, 2020----
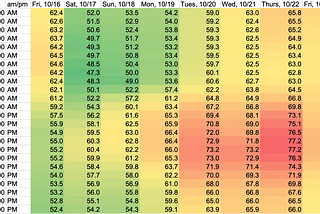
Haley BartelConditional Formatting and DatawrapperIn this data, I can see how New York’s weather has fluctuated this past week in a more creative, visual way. The color-coding tells me…2 min read·Oct 28, 2020----
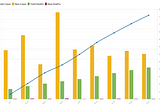
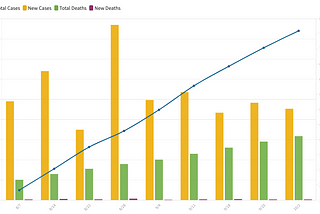
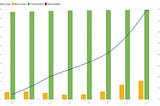
Haley BartelHomework 5: All the Chart TypesHere, I have the second set of data for my midterm.2 min read·Oct 3, 2020----
Haley BartelFirst Midterm VisualizationI chose to put some pretty general information in this graph in order to get the hang of putting data into Flourish, and Belgium seemed as…1 min read·Sep 30, 2020----